Plotting occurrence data from the query "Download record counts of Peron's tree frog since 2018 in New South Wales by FrogID"
Overview
Teaching: 10 min
Exercises: 10 minQuestions
How can I make a map using occurrence records from the ALA?
Objectives
Be able to download occurrence records, including select columns of data
Plot a shape file using geopandas
Plot occurrence records from the ALA in context with a shape file
Download occurrence records
Remember the query we built from Episode 2:
Download record counts of Peron's tree frog since 2018 in New South Wales by FrogID
galah.atlas_counts(
    taxa="litoria peronii",
    filters=["year>=2018",
             "cl22=New South Wales",
             "dataResourceName=FrogID"]
)
   totalRecords
0         39840
All we have to do to download occurrences is to change the function name atlas_counts to atlas_occurrences, but first, we need to provide an email registered with the ALA to galah-python:
galah.galah_config(email="amanda.buyan@csiro.au")
galah.atlas_occurrences(
    taxa="litoria peronii",
    filters=["year>=2018",
             "cl22=New South Wales",
             "dataResourceName=FrogID"]
)
       decimalLatitude  decimalLongitude             eventDate  ...                              recordID dataResourceName occurrenceStatus
0           -37.246800        149.375000  2020-12-27T00:00:00Z  ...  56de6c10-b14d-4eeb-86ee-a50e406678d3           FrogID          PRESENT
1           -37.245410        149.957044  2022-10-26T00:00:00Z  ...  685271bf-5bbf-4174-b8e2-c92c4b5ee586           FrogID          PRESENT
2           -37.245385        149.957663  2021-12-11T00:00:00Z  ...  4155af9f-38bf-4093-976f-65d17029d1c4           FrogID          PRESENT
3           -37.245385        149.957663  2021-12-11T00:00:00Z  ...  aee93398-6e27-4134-a1c3-9a4c794d1ce6           FrogID          PRESENT
4           -37.245385        149.957663  2021-12-11T00:00:00Z  ...  360887c3-4af9-4430-801e-8b7db47a2389           FrogID          PRESENT
...                ...               ...                   ...  ...                                   ...              ...              ...
39835       -28.207514        153.442592  2018-11-15T00:00:00Z  ...  10ec5c96-fb1e-4545-9e85-dc9073e3a977           FrogID          PRESENT
39836       -28.207494        153.442526  2021-11-17T00:00:00Z  ...  302250c5-6b7b-4d5d-b51b-12fa305ae8c9           FrogID          PRESENT
39837       -28.207472        153.442497  2018-11-15T00:00:00Z  ...  101f5f04-b0e9-45b4-a9c0-3e50d97f1dfe           FrogID          PRESENT
39838       -28.207442        153.442328  2020-02-07T00:00:00Z  ...  f827c2ef-fcf4-40cc-ab3d-fc1f4ec8c61b           FrogID          PRESENT
39839       -28.207108        153.443021  2021-02-19T00:00:00Z  ...  f02823d8-f53a-4cde-b546-d3bd7ff7b075           FrogID          PRESENT
All of this data for each occurrence record is great! However, say you want to only get specific columns of the table, like decimalLatitude,decimalLongitude and scientificName. You can specify column names in the fields argument of atlas_occurrences:
galah.galah_config(email="amanda.buyan@csiro.au")
galah.atlas_occurrences(
    taxa="litoria peronii",
    filters=["year>=2018",
             "cl22=New South Wales",
             "dataResourceName=FrogID"],
    fields=["scientificName","decimalLatitude","decimalLongitude"]
)
        scientificName  decimalLatitude  decimalLongitude
0      Litoria peronii       -33.624100        151.323000
1      Litoria peronii       -33.718800        151.003000
2      Litoria peronii       -33.324700        151.365000
3      Litoria peronii       -33.572700        148.436000
4      Litoria peronii       -35.115900        147.981000
...                ...              ...               ...
39835  Litoria peronii       -33.817474        151.177367
39836  Litoria peronii       -33.948932        151.251668
39837  Litoria peronii       -33.930552        151.237679
39838  Litoria peronii       -33.686587        151.096895
39839  Litoria peronii       -33.448529        151.375129
Make a map of Litoria peronii occurrence records since 2018 in New South Wales
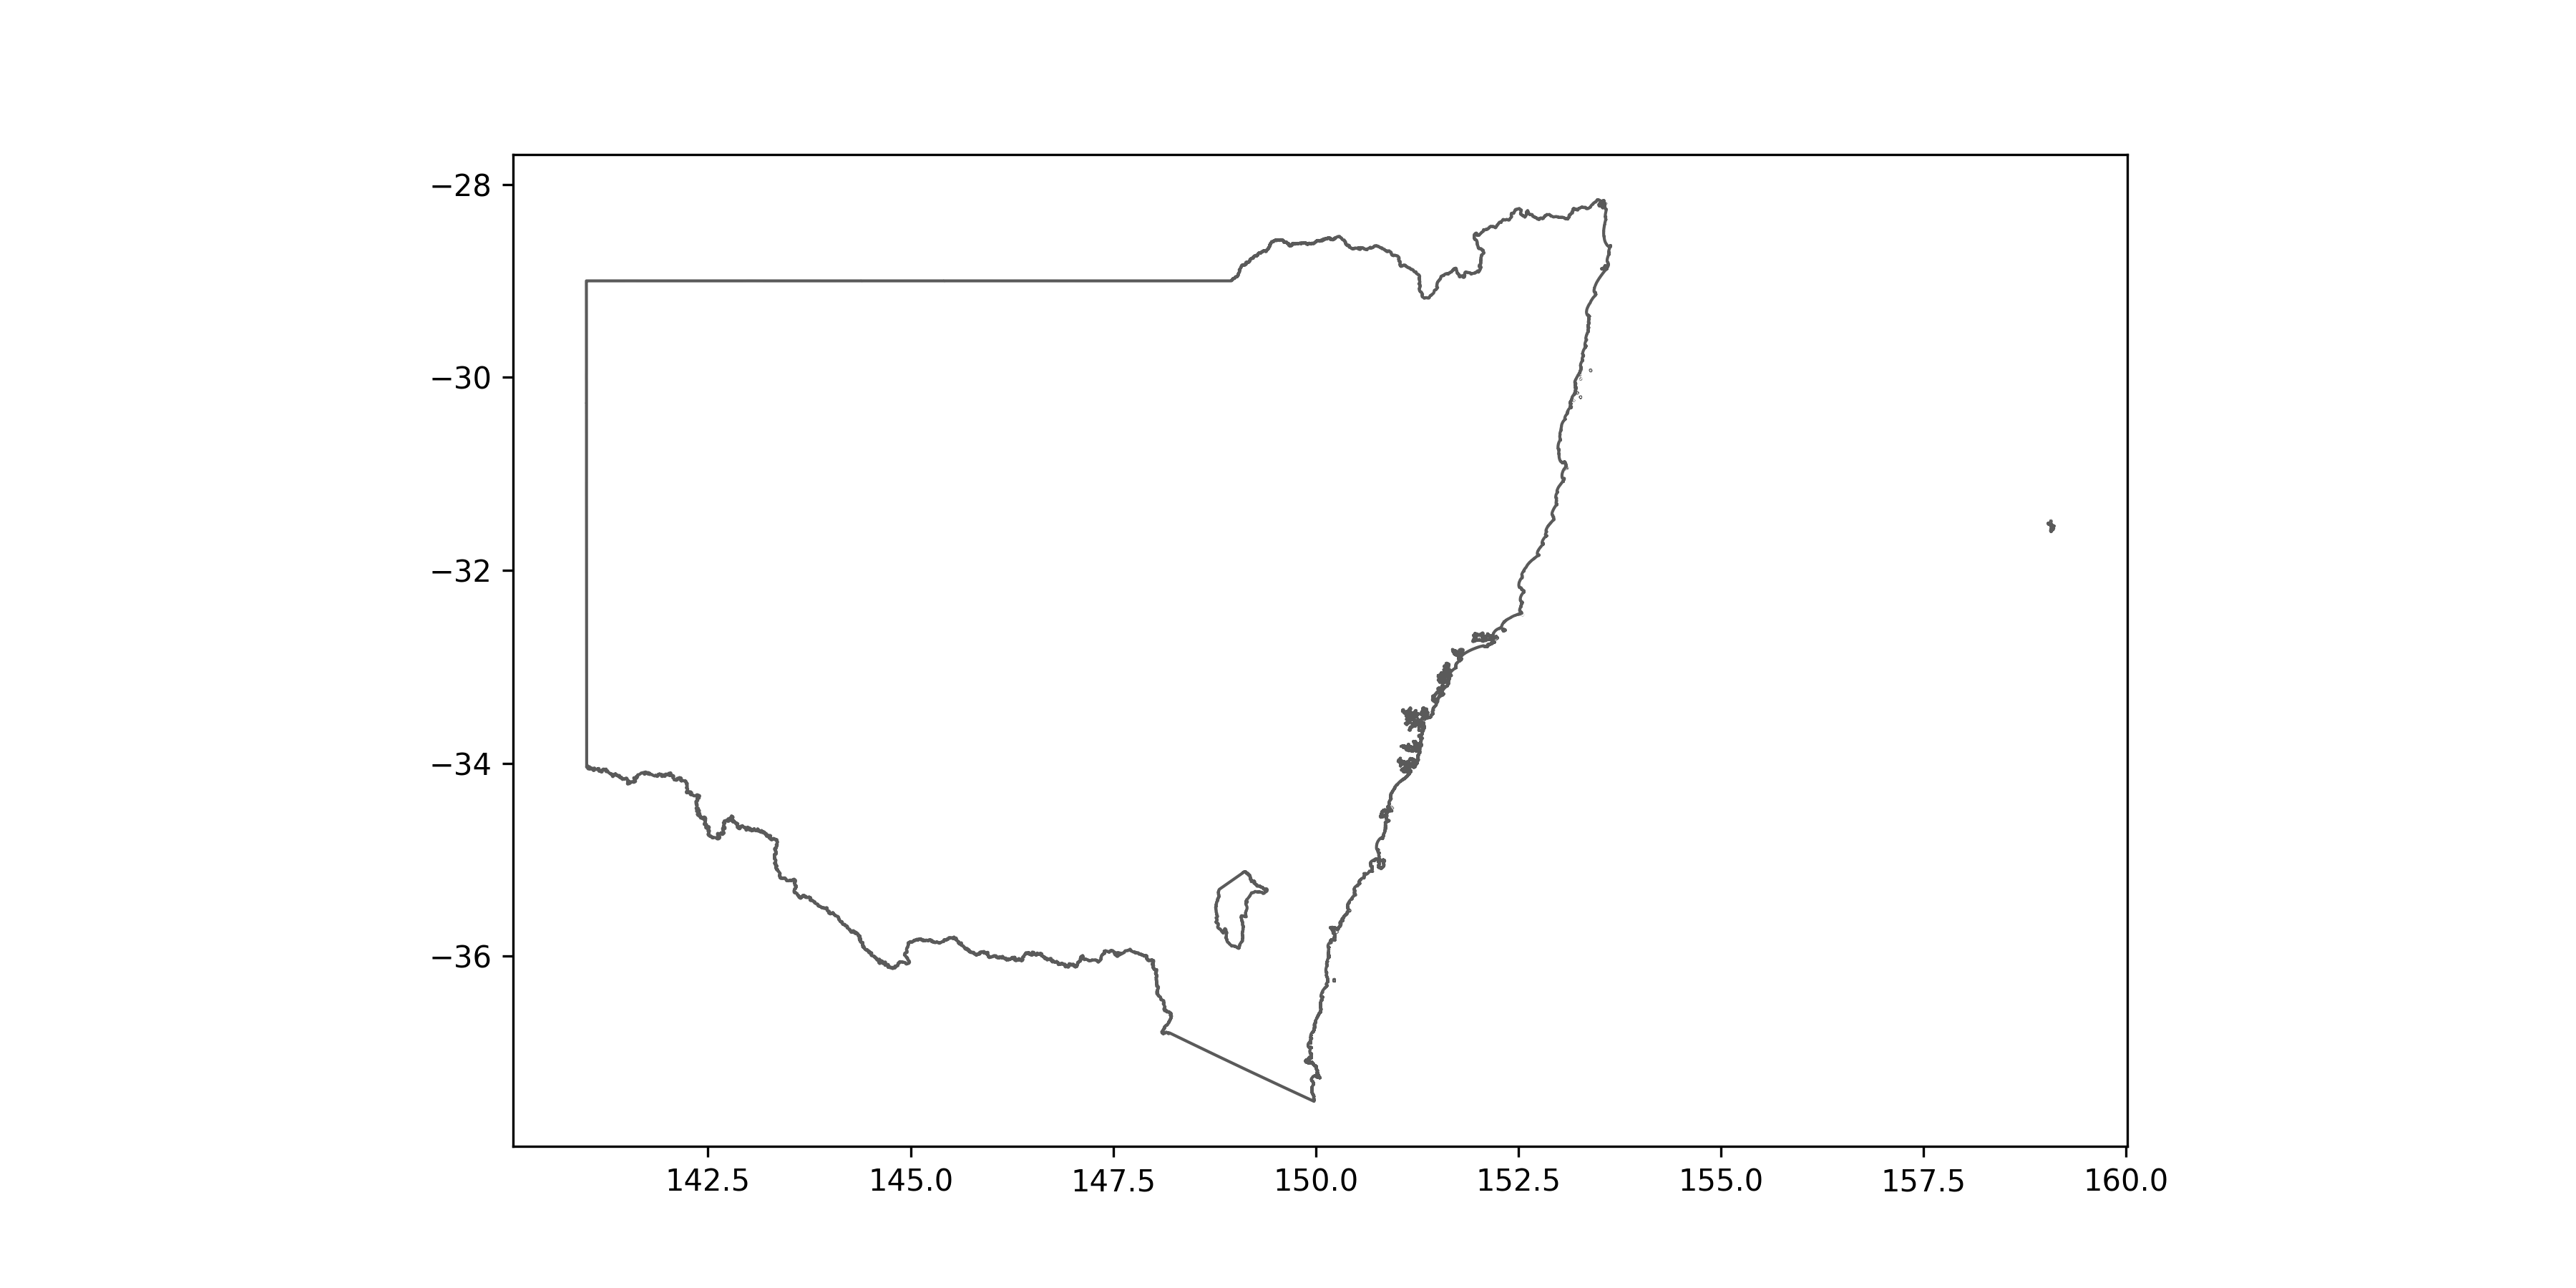
Now, we will make a map showing where all the occurrence records we downloaded are in New South Wales. This is where the packages matplotlib and geopandas you installed at the beginning of the lesson will be used. The shape file you will need for this exercise can be found here.
import galah
from matplotlib import pyplot as plt
import geopandas as gpd

# Get Peron's tree frog occurrences
frogs = galah.atlas_occurrences(
  taxa="litoria peronii",
  filters=["year>=2018",
           "cl22=New South Wales",
           "dataResourceName=FrogID"],
  fields=["scientificName","decimalLongitude","decimalLatitude"]
)

# Get Australian state and territory boundaries
states = gpd.read_file("STE_2021_AUST_GDA94.shp")

# Change Coordinate Reference System (CRS) of the shape file and plot New South Wales
states = states.to_crs(4326)
states[states["STE_NAME21"] == "New South Wales"].plot(edgecolor = "#5A5A5A", linewidth = 1.0, facecolor = "white", figsize = (24,10))
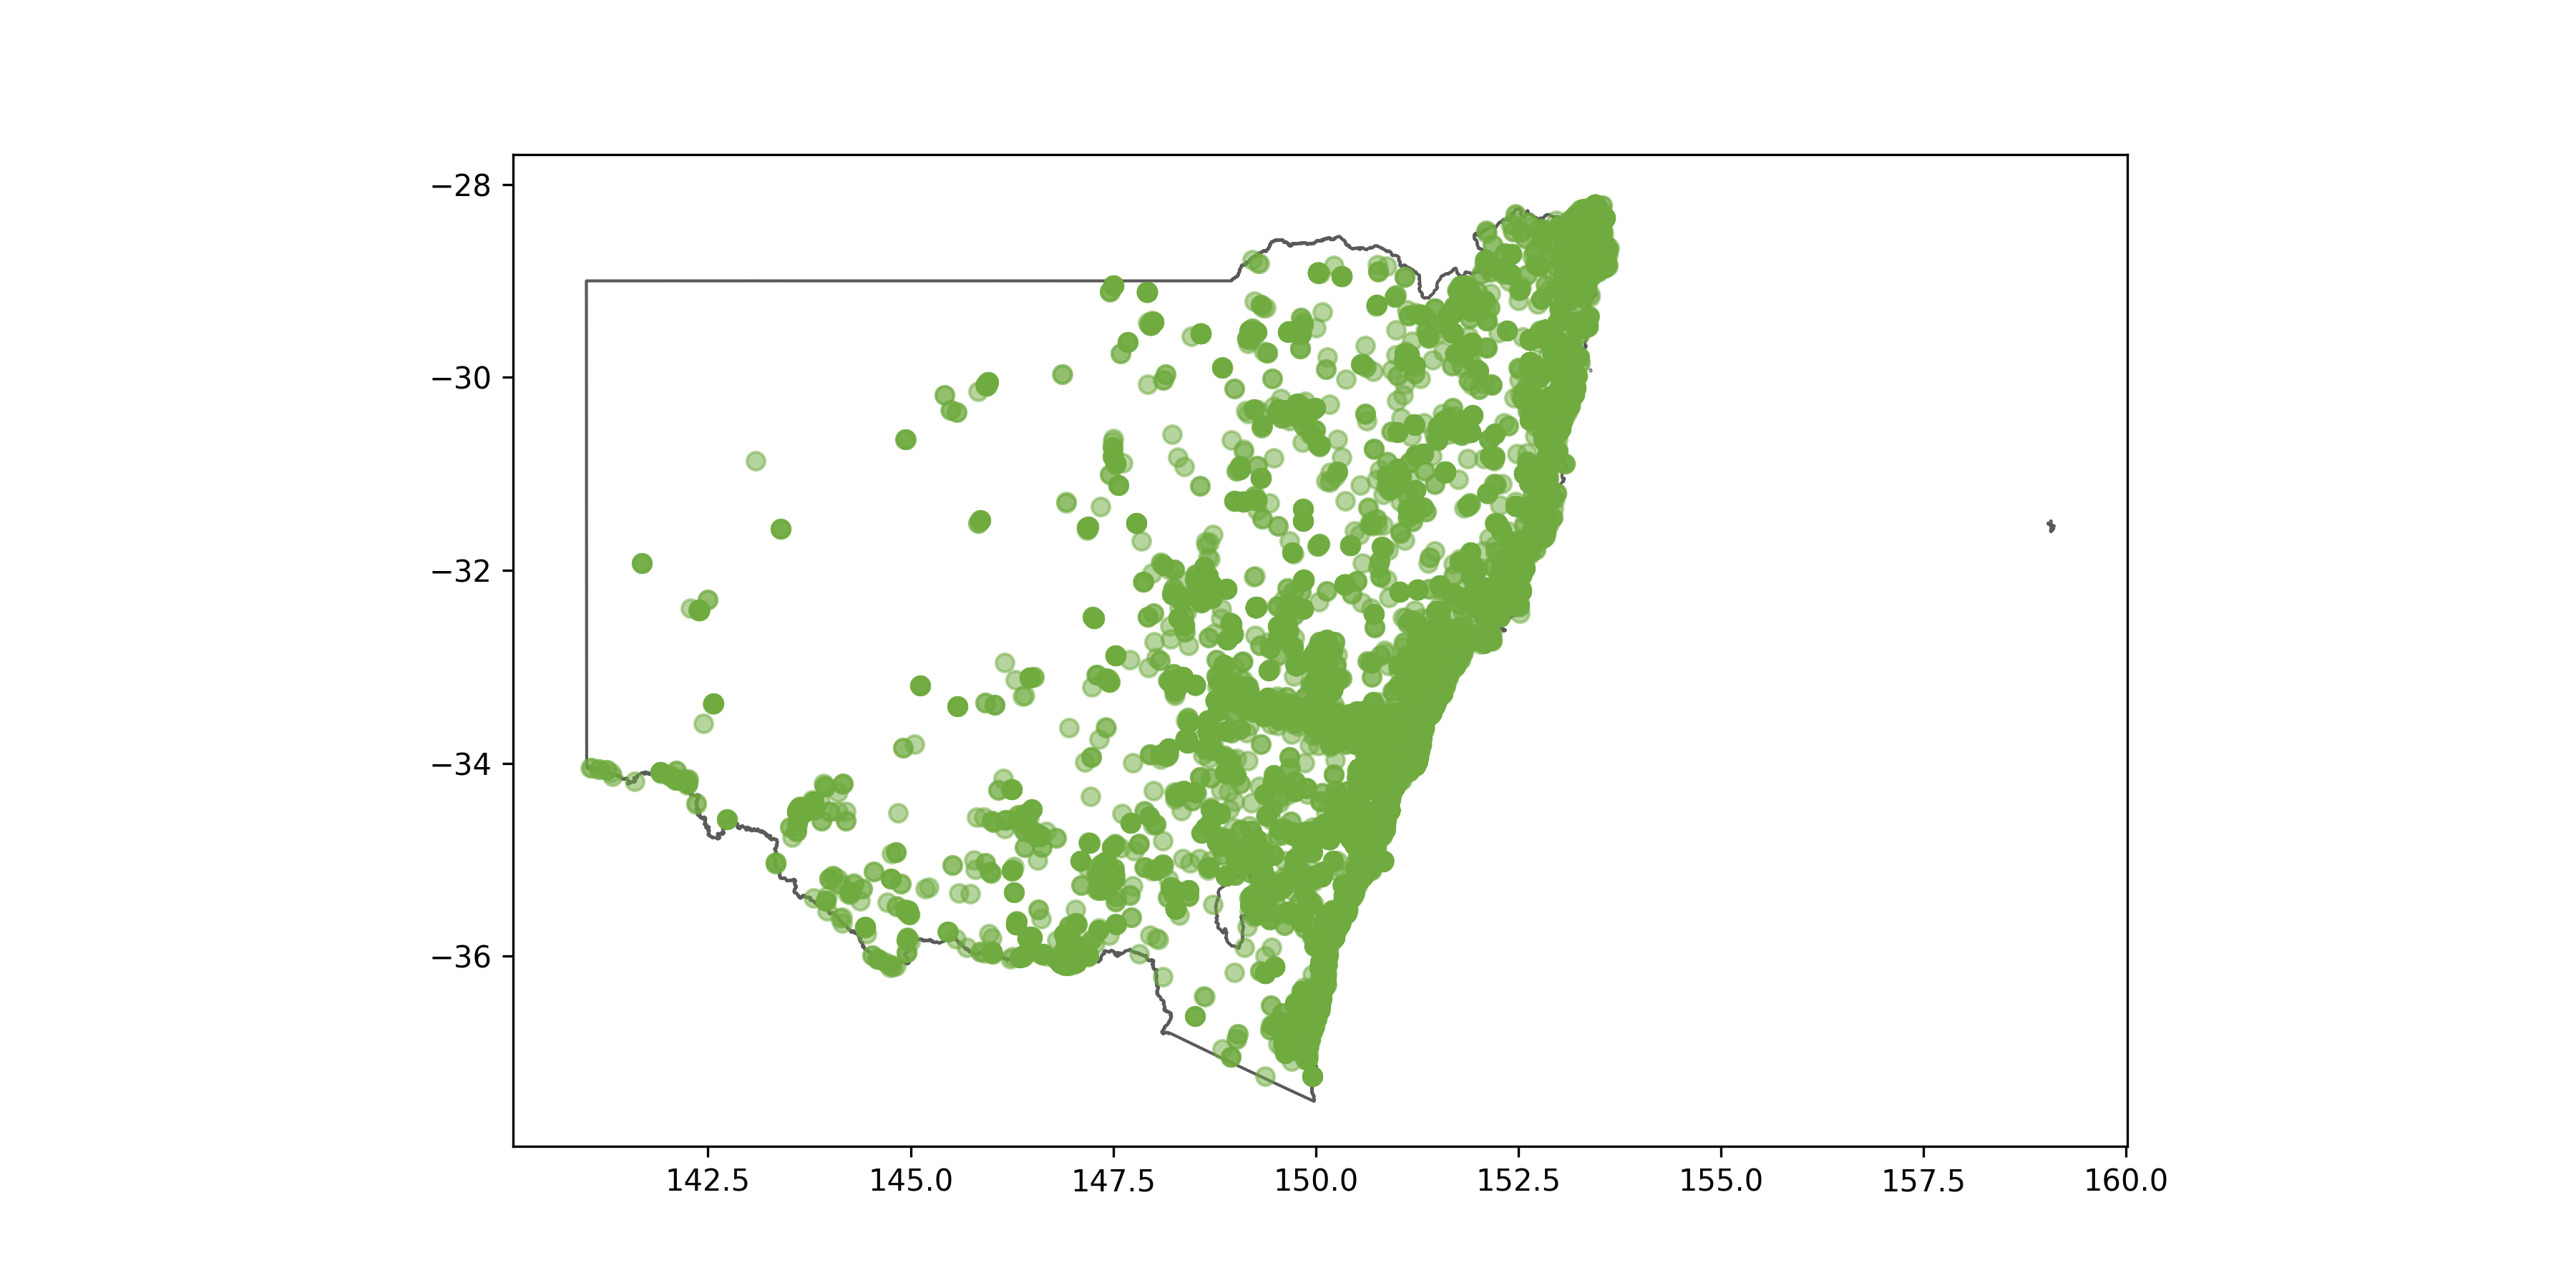
# Add occurrence records to the map
ax = states[states["STE_NAME21"] == "New South Wales"].plot(edgecolor = "#5A5A5A", linewidth = 1.0, facecolor = "white", figsize = (24,10))
plt.scatter(frogs['decimalLongitude'],frogs['decimalLatitude'], c = "#6fab3f", alpha = 0.5)
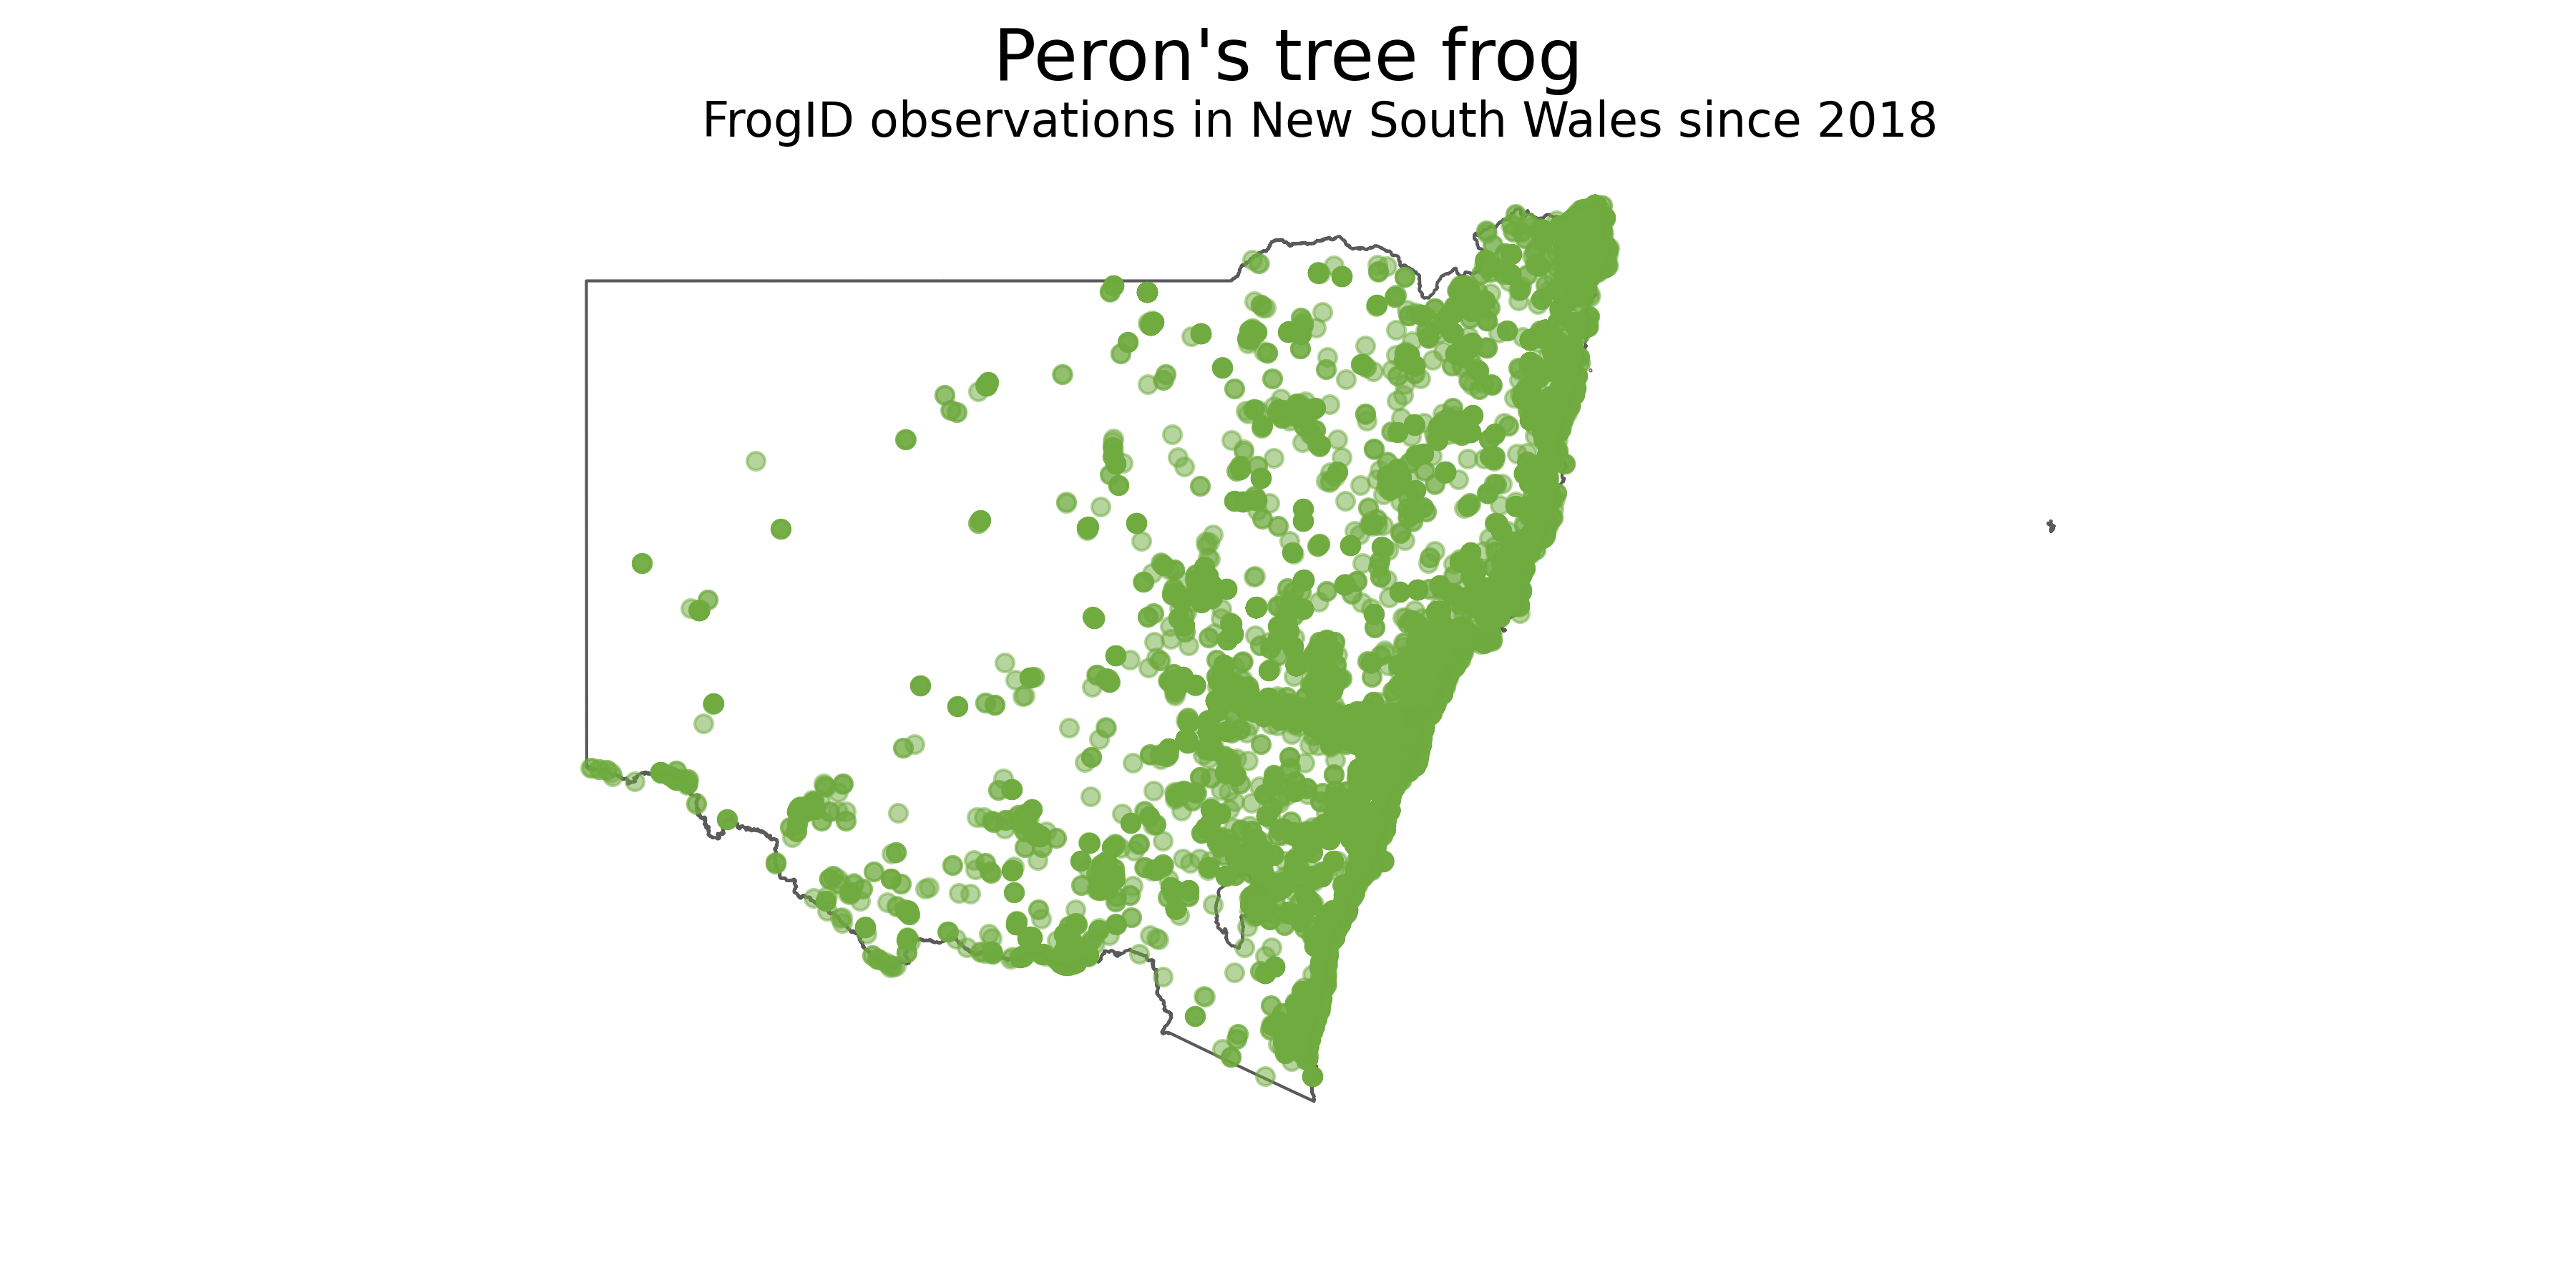
# Add final touches to figure
plt.suptitle("Peron's tree frog",fontsize=24)
plt.title("FrogID observations in New South Wales since 2018",fontsize=16)
plt.axis('off')
Key Points
Occurrence records can be downloaded by using queries from
atlas_counts(), but using the functionatlas_occurrencesinsteadYou can specify what columns of data you want from
atlas_occurrences()by using thefieldsoptionPlotting the occurrence data on a map can be done with
galah-python,matplotlibandgeopandas